In this post, we present a pipeline for scRNA-seq analysis of lymphocytes (B-cells, T-cells and NK-cells) using the “census of immune cells” dataset from the Human Cell Atlas project. We will walk through the analysis step-by-step and mention the main differences between scRNA-seq and bulk RNA-seq.
1. Quality Control
High quality libraries are considered as a prerequisite to scRNA-seq analysis to ensure accurate results and avoid misleading outcomes. Low-quality libraries in scRNA-seq data are usually due to cell damage and could be detected by identifying cells with small library size or few expressed genes.
This dataset contains 33500 gene expressions for 380,000 cells, generated using the 10X Genomics technology. We may use the terms “features” and “expressed genes” interchangeably, also the terms “library” and “cell” could be also used interchangeably. We started with per cell QC, the library size is the first quality metric and defined as the total sum of counts across all gene expressions for each cell. Knowing that, cells with small library size are of low quality as they signal RNA damage (Figure 1 – Left). The number of features per cell is the second quality metric and defined as the total number of genes for each cell with non-zero gene expression counts (Figure 1 – Right).

After that, we performed per feature QC. This quality metric calculates for each feature, the percentage of cells with non-zero gene expression counts. We discarded features that were not expressed in any cell (Figure 2).

2. Cell Classification
The goal of this post is to analyze the differences in gene expression profiles between lymphocytes (B-cells, T-cells and NK-cells) and identify top marker genes for each cell type. Therefore, we needed to classify and label the cells in the HCA bone marrow dataset with their cell types to extract lymphocytes only for downstream analysis.
We used an automated approach (Aran et al. 2019) to compare our gene expression profiles for each cell to a reference dataset that has already been accurately annotated by domain experts (Mabbott et al. 2013). Table 1. shows the labeled cell counts per individual donor.
| MantonBM1 | MantonBM2 | MantonBM3 | MantonBM4 | MantonBM5 | MantonBM6 | MantonBM7 | MantonBM8 | |
| B cells | 6164 | 11612 | 3462 | 4444 | 6598 | 4203 | 5845 | 4397 |
| T cells | 18965 | 19130 | 19395 | 12253 | 13729 | 19630 | 22374 | 22867 |
| NK cells | 1765 | 6595 | 4087 | 4781 | 2274 | 2416 | 4130 | 2227 |
| Chondrocytes | 2 | 1 | 0 | 2 | 1 | 0 | 1 | 1 |
| CMP | 538 | 114 | 433 | 878 | 869 | 832 | 560 | 1029 |
| DC | 13 | 5 | 23 | 8 | 16 | 2 | 3 | 2 |
| Endothelial cells | 4 | 1 | 6 | 1 | 2 | 3 | 2 | 1 |
| Erythroblast | 1013 | 510 | 386 | 1731 | 3310 | 750 | 809 | 718 |
| Fibroblasts | 0 | 0 | 0 | 0 | 0 | 0 | 0 | 1 |
| GMP | 782 | 176 | 770 | 1500 | 1492 | 868 | 505 | 948 |
| Hepatocytes | 0 | 0 | 0 | 1 | 0 | 0 | 0 | 0 |
| HSC G-CSF | 159 | 16 | 54 | 146 | 127 | 105 | 92 | 84 |
| HSC CD34+ | 13 | 0 | 11 | 20 | 17 | 7 | 4 | 7 |
| Macrophage | 34 | 5 | 253 | 35 | 45 | 0 | 19 | 6 |
| MEP | 756 | 201 | 509 | 923 | 1462 | 674 | 415 | 692 |
| Monocyte | 4727 | 4358 | 9484 | 11636 | 8741 | 5390 | 4815 | 6673 |
| Myelocyte | 52 | 6 | 30 | 78 | 104 | 66 | 13 | 35 |
| Pro Myelocyte | 307 | 48 | 169 | 414 | 550 | 180 | 91 | 163 |
| Neutrophils | 13 | 5 | 67 | 53 | 50 | 9 | 3 | 18 |
| Osteoblasts | 4 | 0 | 4 | 4 | 0 | 7 | 0 | 1 |
| Platelets | 73 | 101 | 57 | 38 | 57 | 18 | 81 | 58 |
| Pre B cells CD34- | 1266 | 404 | 936 | 2606 | 1974 | 1095 | 625 | 1088 |
| Pro B cells CD34+ | 2336 | 1305 | 242 | 1809 | 586 | 783 | 2382 | 838 |
| Smooth muscle cells | 5 | 3 | 1 | 0 | 4 | 7 | 3 | 1 |
| Tissue stem cells | 65 | 9 | 53 | 39 | 34 | 26 | 19 | 9 |
An interesting visualization (Figure 3) provides more insights about cell populations of each donor. For instance, we may notice slightly higher count of B cells for the second donor “MantonBM2” and higher counts of T cells for the last two donors “MantonBM7” and “MantonBM8”.

3. Dimensionality Reduction and Graph-based Clustering
scRNA-seq analysis compares large number of cells based on their transcriptomic profiles. One analytical approach involves clustering to identify cells with similar transcriptomic profiles then performing differential gene expression analysis between clusters. Given that, each individual gene represents a dimension of the transcriptomic data, dimensionality reduction of features followed by graph-based clustering may come in as a handy solution prior differential gene expression analysis.
Initially, we computed the log-transformed normalized expression values from the expression counts, followed by dimensionality reduction using the uniform manifold approximation and projection (UMAP) method (McInnes, Healy, and Melville 2018). Finally, a “two-step” clustering, k-means was initially used to obtain representative centroids (step-1) that are subjected to a nearest-neighbor graph-based community detection method (step-2).
We identified 15 clusters that seem to be interestingly separated when colored by cell type (Figure 4); clusters 2, 9, 13, 14 belong to B cells, clusters 1, 3, 4, 5, 7, 8, 10, 11, 12 belong to T cells, and cluster 6 belong to NK cells. Cluster 15 lies between B and T cells and contains a population of B cells and small amount of T cells.

We selected clusters 2, 9, 13 as representative clusters of B cells, clusters 4, 7, 8 as representative clusters of T cells, and cluster 6 as a representative cluster of NK cells. We merged and identified the centroid of these representative clusters then selected 10,000 nearest neighbors to each centroid using k-nearest neighbor algorithm. The main goal was to obtain three equal sized and more compact clusters of each cell type and free from ambiguous cells (Figure 5). These 3 clusters can be used for downstream analysis in order to identify marker genes differentiating B cells, T cells, and NK cells.

4. Differential Gene Expression Analysis
We tested for differential gene expressions between pairs of clusters using pairwise t-tests to identify marker genes for B cells, T cells and NK cells. We selected the top 15 marker genes from each pairwise comparison as a brief example in order to visualize and interpret the results (Figure 6).
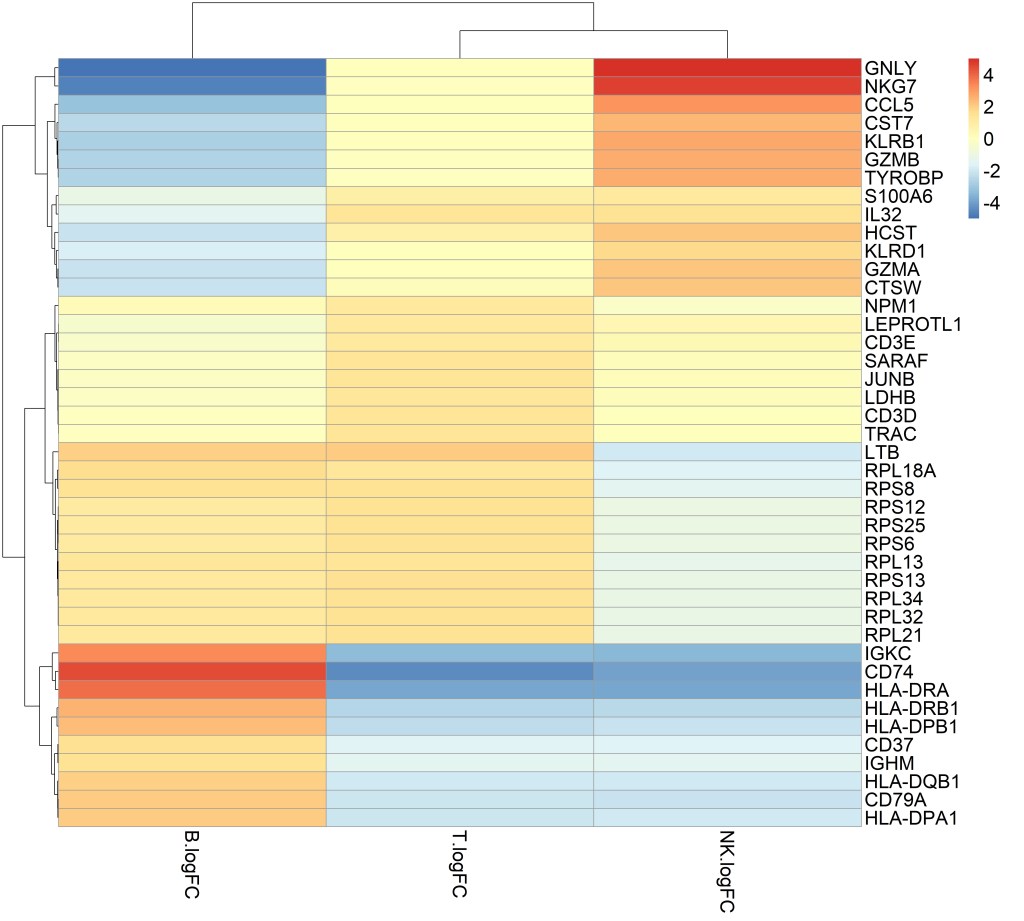
The first observation that top marker genes show similar expression variations in T cells and NK cells but expression levels are different. The top two genes that clearly distinguish NK cells from T cells and B cells are NKG7 and GNLY; NKG7 is a protein coding gene known as Natural Killer Cell Granule Protein 7 and GNLY is a member of the saposin-like protein family (SAPLIP) and is located in natural killer cells, Innate Immune Systems is among its related pathways. On the other hand, TRAC, CD3D and CD3E distinguish T cells from NK cells and B cells; TRAC is a protein coding gene known as T Cell Receptor Alpha Constant, CD3D and CD3E are protein coding genes that are part of the T-cell receptor/CD3 complex.
B cells top marker genes show different expression patterns from T cells and NK cells. Immunoglobulin genes were expressed as B cells marker genes such as IGKC (Immunoglobulin Kappa Constant) and IGHM (Immunoglobulin Heavy Constant Mu). The most noticeable marker genes were CD74 and HLA class II beta chain paralogs (HLA-DRA, HLA-DRB1, HLA-DPB1, and HLA-DQB1); HLA class II molecules play an important role in the immune response by presenting peptides on the surface of various antigen presenting cells such as B lymphocytes while CD74 is a protein coding gene that regulates antigen presentation for immune responses.
5. Analysis of scRNA-seq data versus bulk RNA-seq data
scRNA-seq generates the transcriptomic profile of each cell in a tissue sample and captures its heterogeneity at the single cell level while bulk-RNA-seq averages gene expression across a population of cells in a tissue sample. Bulk RNA-seq is useful in differential gene expression analysis between samples of the same tissue in different study conditions such case-control studies. The main advantage of scRNA-seq is the ability to analyze phenotypes at single cell resolution, it permits defining biological questions when transcriptomic cell-specific changes needs to be profiled and clearly understood such as: identification of cell types within heterogeneous tissue sample, quantification of heterogeneous cell responses in different study conditions, estimation of stochasticity and distribution of gene expressions in homogenous cells.
